Google Maps
- Google Maps
Google Maps is a sophisticated mapping service that leverages various technologies to provide accurate and efficient navigation.
This document provides a comprehensive overview of how Google Maps uses map tiles for rendering maps and routing tiles for calculating directions, incorporating real-time data for optimal route planning.
Map Tiles
What are Map Tiles?
- Suppose you want to render world map on a Web App at different Zoom levels
- Starting image size is
512x512 - Subsequent Zoom level would have
4x Clarity/Detailsthe information - Now, we have 2 ways:
Option 1: 1 Image at each Zoom level- This works fine at a very high zoom level
- A small size image of
512x512atZoom 0would serve the purpose. Image Size -256KB - Zoom 1 -
512x512x4 = 2048x2048 = 4MB - Zoom 2 -
2048x2048x4 = 16MB - Zoom 3 - 64MB
- Zoom 4 - 256MB
- Zoom 5 -
1GB - We need Zoom upto level 25 & just at Zoom 5, we have 1GB Image
- Downloading & Rendering such an image would be time & cpu intensive
Option 2: Each Image has a fixed size of512x512& data is split between imagesZoom 0- 1 image of512x512- Zoom 1 - 4 images of
512x512 - Zoom 2 - 16 images
- Zoom 3 - 64 images
- As we can see that option 2 scales well, so Map data is divided into images as we Zoom
- These images are called
Map Tiles:Map tilesare small, square images that represent a specific geographic area at a specific zoom level- These tiles are pieced together to form the complete map that users see in Google Maps
- Reference Videos
Storage and Hierarchical Structure
Tile Pyramid: Google Maps uses a tile pyramid structure to manage map tiles. At each zoom level, the world map is divided into increasingly smaller tiles:Zoom Level 0: The entire world fits into one tile.Zoom Level 1: The world is divided into 4 tiles (2x2 grid).Zoom Level 2: The world is divided into 16 tiles (4x4 grid), and so on.No of Tiles at a Zoom level n: Zoom level 0 has 1 tile & each tile is next Zoom level is broken into 4 tile in next zoom level. So, tiles at Zoom level n -4^n
Storage Format:- Tiles are typically stored in compressed formats such as
PNGorJPEGto save space and bandwidth
- Tiles are typically stored in compressed formats such as
Content Delivery Networks (CDNs):- Google uses a network of geographically distributed servers to store tiles
- CDNs reduce latency and speed up the delivery of tiles to users.
Area Mapping with Zoom levels
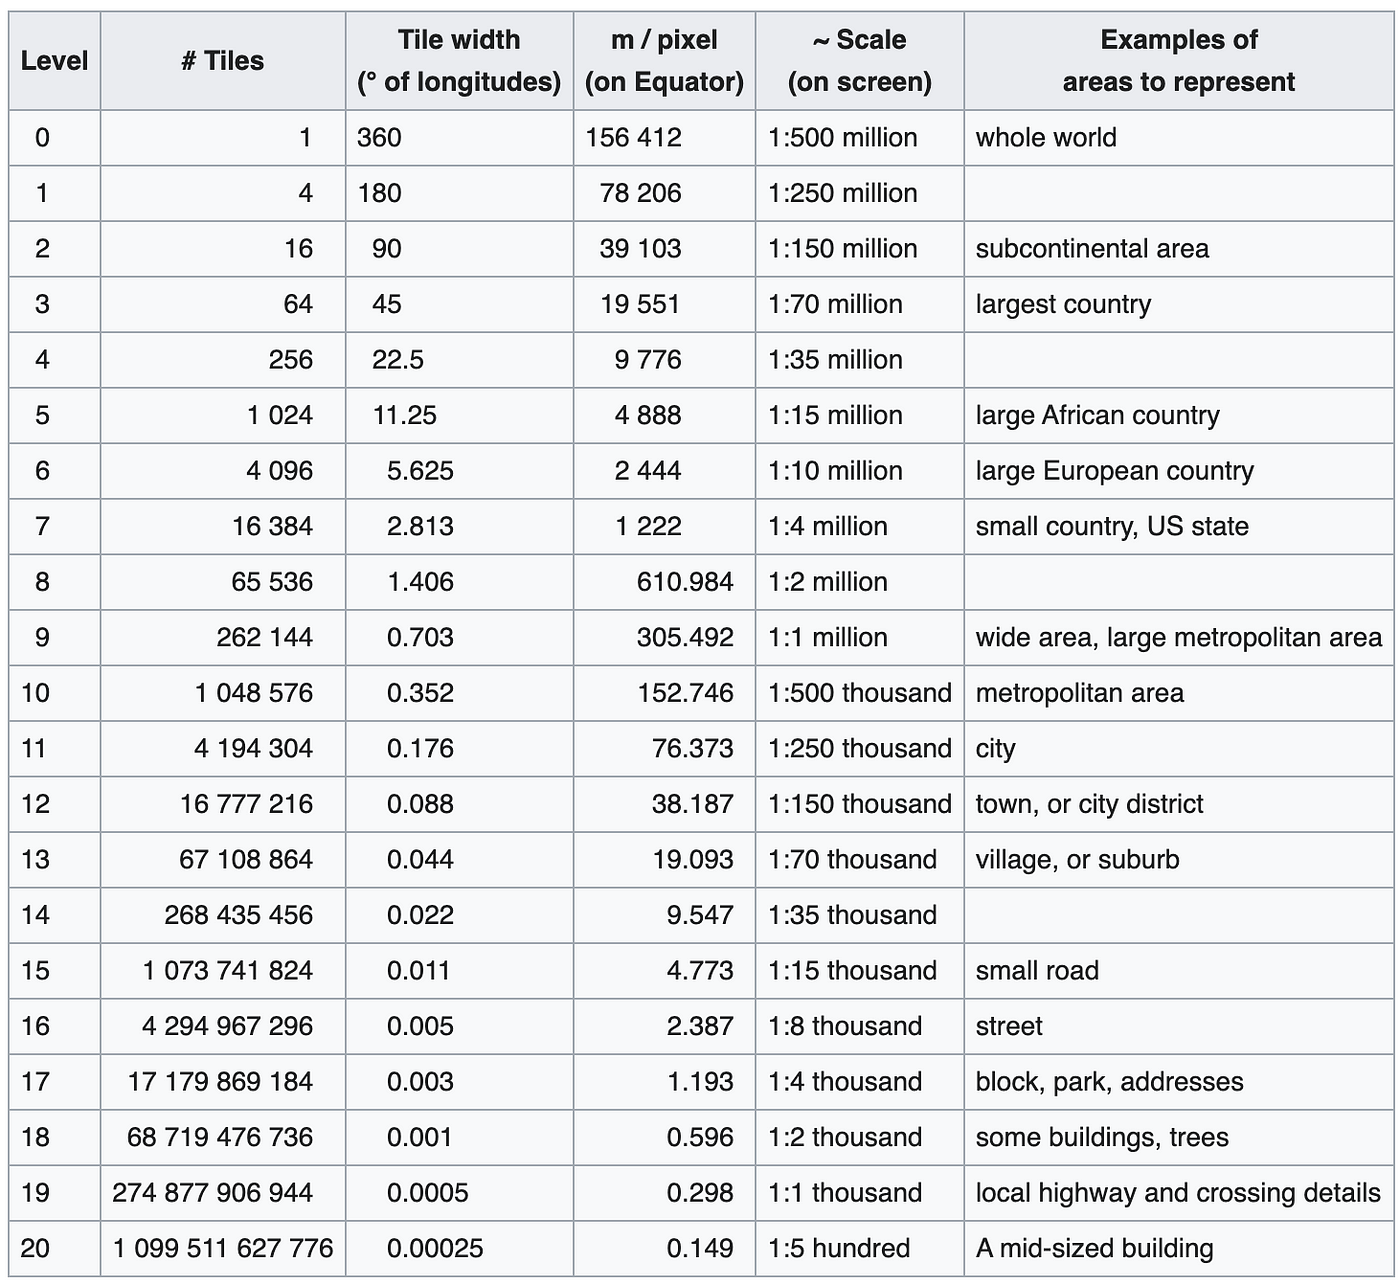
Here’s a detailed table that outlines the relationship between the number of characters in a Geohash, corresponding zoom levels, area coverage, and typical use cases for each level of precision:
| Geohash Length | Approximate Zoom Level | Area Covered | Typical Use Case |
|---|---|---|---|
| 1 | 1-2 | 5,000 km x 5,000 km | Identifying large regions such as continents |
| 2 | 3-4 | 1,250 km x 625 km | Regional overview, such as a large state in the USA |
| 3 | 5-6 | 156 km x 156 km | Locating major cities |
| 4 | 7-8 | 39 km x 19.5 km | Identifying areas within a city, like neighborhoods |
| 5 | 9-10 | 4.89 km x 4.89 km | Detailed city view, identifying parks or large roads |
| 6 | 11-12 | 1.22 km x 0.61 km | Street-level detail, identifying specific blocks |
| 7 | 13-14 | 153 m x 153 m | Pinpointing specific buildings or smaller roads |
| 8 | 15-16 | 38 m x 19 m | Precise addressing, individual addresses or entrances |
| 9 | 17-18 | 4.77 m x 4.77 m | Very precise location, identifying specific objects |
| 10 | 19-20 | 1.19 m x 0.59 m | Extremely detailed, pinpoint accuracy for devices |
Explanation of the Table
-
Geohash Length: Represents the number of characters in the Geohash string. Each character adds more precision. -
Approximate Zoom Level: These zoom levels are approximations for digital mapping systems like Google Maps or OpenStreetMap, where higher zoom levels show more detail. The association between Geohash length and zoom level isn’t exact and can vary based on specific implementations and map settings. -
Area Covered: This column provides a rough estimate of the area covered by each Geohash length. The area dimensions decrease as the Geohash gets longer. -
Typical Use Case: Describes common scenarios or applications for each Geohash length.
Rendering on Devices
Pre-fetching: The app pre-fetches and caches tiles for the surrounding area to ensure a smooth experience when panning the map.Caching: Frequently accessed tiles are cached on the device to minimize redundant downloads and improve speed.Efficient Requests: The app requests only the necessary tiles based on the user’s viewport and zoom level.Tiling: The app assembles and renders the tiles quickly to display the map seamlessly as the user navigates.
Static Image Representation
- Each map tile is a static image representing a small, fixed portion of the map at a specific zoom level.
- Typically, each tile is 512x512 pixels.
- The map displayed on the device is a composite of many such tiles stitched together.
Routing Tiles
Concept and Purpose
- Routing Tiles are a
Server-Side Concept - Google Maps uses
Graphsto representroad datafor navigation purposes - In this graph, roads form
edges& intersections formnodes - And a variation of
Dijkstra'salgo is used to identify shorted path betweenPoint A -> B - Now, the question is
how big the graph should be?- Should we have 1 graph for whole world?
- Or graph for each country?
- or for each city or county?
- In real world applications,
performance of path finding algos is extremely senstive to size of graph - So, smaller the graph, faster the evalution
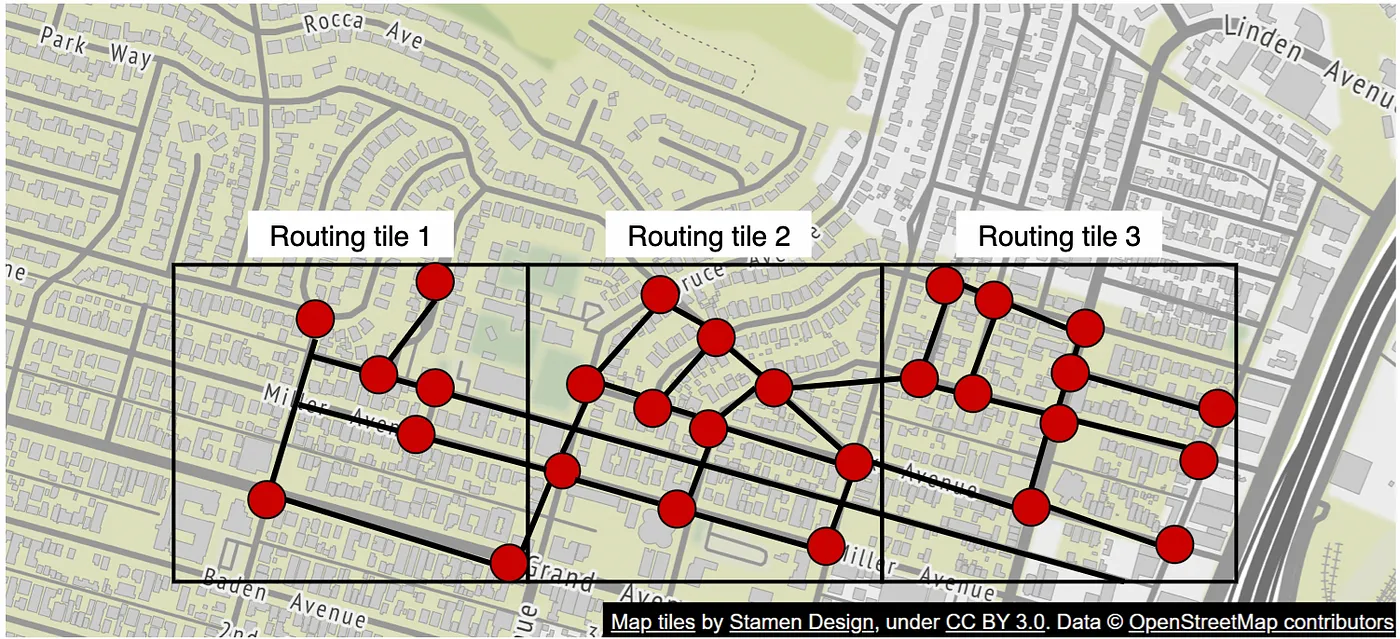
- Inspired by Map tiles, the
road graphswere broken into very small pieces of road data called -routing tiles - For
A -> Bnavigation, shorted path would be calculated for many such graphs & then, sitched together to provide correct answer - Essentially,
Routing tilesare used to efficiently calculate routes for navigation -
Unlike map tiles, which are primarily for visual representation, routing tiles contain detailed data about the road network
Structure and Storage
Graph Representation: Routing tiles store road networks as graph data structures. Nodes represent intersections or waypoints, and edges represent road segments.Hierarchical Organization: The road network is partitioned into smaller, manageable tiles, similar to map tiles, but optimized for routing.Data Format: Routing tiles are typically stored in binary formats optimized for fast read and write operations.Distributed Storage: Data is stored in a distributed database system (e.g., Google Cloud Bigtable) to ensure scalability and reliability.
Efficiency and Processing
Scalability: Storing the entire road network as a few large graphs would be computationally expensive. Routing tiles break down the network into smaller graphs, making route calculations more efficient.Real-Time Data: Traffic conditions, road closures, and other real-time data are integrated into routing tiles to provide up-to-date routing information.
How Routing Tiles Work
User Requests Directions: The user inputs a destination and requests directions.Server-Side Processing:- The server identifies the relevant routing tiles for the source, destination, and potential paths.
- These tiles are fetched and processed to calculate the optimal route.
Graph Data: The server uses the graph data from the routing tiles, considering real-time traffic and road conditions.Route Calculation: The optimal route is calculated using algorithms that process the graph data.Returning the Route: The calculated route is sent back to the app.
Rendering Directions
Overlaying on Map Tiles: The app overlays the calculated route on the map tiles.Turn-by-Turn Navigation: The app provides turn-by-turn navigation instructions based on the calculated route.
Integration of Map Tiles and Routing Tiles
User Journey Example
Opening Google Maps:- The user opens the Google Maps app.
- The app requests map tiles for the current view and pre-fetches nearby tiles.
Requesting Directions:- The user inputs a destination.
- The app sends a routing request to the server.
Fetching Data:- The server fetches relevant routing tiles and map tiles.
- Routing tiles provide data for route calculation.
- Map tiles provide visual representation.
Calculating the Route:- The server uses the routing tiles to calculate the optimal route.
- Real-time traffic data is integrated to ensure accuracy.
Rendering the Route:- The app overlays the calculated route on the map tiles.
- The user sees the route highlighted on the map and receives turn-by-turn navigation instructions.
Dynamic Updates:- As the user follows the route, the app updates the displayed route based on real-time conditions.
- New tiles are fetched as the user moves, and routing adjustments are made if necessary.
Accuracy and Data Sources
Accuracy of Streets
Google Maps displays streets accurately due to the integration of various data sources:
Satellite Imagery: High-resolution images provide detailed views of the Earth’s surface.Street View Imagery: Ground-level images capture street details.GPS Data: Real-time data from devices helps verify road layouts.Public and Government Data: Official maps and records provide reliable information.User-Generated Data: Contributions from users help keep maps current.Commercial Data Providers: Licensed data from third-party providers enhances accuracy.
Data Processing
Data Fusion: Integrating multiple data sources ensures a comprehensive and accurate map.Machine Learning and AI: Advanced algorithms analyze data to identify patterns and correct inaccuracies.Manual Verification: Human operators validate data in complex or newly developed areas.
Continuous Updates
Real-Time Updates: Traffic and road conditions are updated in real-time.Change Detection: Algorithms detect changes in satellite imagery and user reports, triggering map updates.
Conclusion
Google Maps uses a sophisticated system of map tiles and routing tiles to provide accurate and efficient navigation. Map tiles render the visual map, while routing tiles enable fast and precise route calculations. Real-time data integration ensures that users receive the most current and reliable directions. Understanding these concepts provides insight into the complexity and efficiency of modern digital mapping services.